The U.S. Department of Agriculture announced on June 5 that scientists have updated a widely used cover crop chart, initially created in 2010. The purpose of the chart is to help producers select the best cover crop to meet their needs. It was created by Mark Liebig and his colleagues at the Agriculture Research Service’s Northern Great Plains Research Laboratory.
“Although a lot of information is available on cover crops, it is often organized by individual crops,” Liebig told AgResearch Magazine. “Unfortunately, this way of looking at cover crops falls short in showing how they could potentially complement each other in mixtures.”
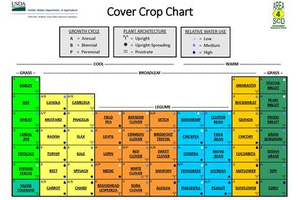
The chart is organized in a similar manner to the periodic table of elements. It shows how a crop species may be planted individually or in mixtures. Additionally, there is information on growth cycles, relative water use, pollination and more.
“We’re basically repackaging information into a useful visual aid—a first step for customers to learn about cover crops,” Liebig continued.
The updated chart now contains 58 new species of cover crops, along with new sections on salt-tolerant grasses and crop placement. U.S. agriculture professionals have been using the chart since 2010, and now, there are producers from 53 other countries that rely on the chart as well.
Research from Penn State’s College of Agricultural Sciences has found that planting cover crops in rotation in between cash crops can provide more ecological value than previously thought. However, many farmers still pass on the opportunity to grow cover crops due to a lack of financial incentives.